FIND DATA: By Author | Journal | Sites   ANALYZE DATA: Help with R | SPSS | Stata | Excel   WHAT'S NEW? US Politics | Int'l Relations | Law & Courts
   FIND DATA: By Author | Journal | Sites   WHAT'S NEW? US Politics | IR | Law & Courts
  A Microsoft Excel Companion to Political Analysis  
The Seventh Edition of The Essentials of Political Analysis is now available! More info. | Read Introduction
Excel Companion cover
Table of Contents
Click chapter title for description and links to resources

Getting Started
This introductory chapter orients students to the basic layout and functionality of Microsoft Excel, emphasizing features most relevant to political data analysis. Students will learn how to navigate Excel workbooks, enter and format data, and prepare to use Excel as a tool for empirical political research.
๐Ÿ“ Print Features: Key Terms
๐Ÿ›ก๏ธ Ancillaries: Test Bank*
๐Ÿ“š Chapter concepts and theories introduced in Essentials of Political Analysis, 7th Edition
* = for instructors, available via Sage
1. Using Excel for Data Analysis
Students begin using Excel for structured data analysis by importing datasets, sorting information, and filtering values. This chapter establishes foundational skills for managing political data and preparing it for statistical exploration.
๐Ÿ“ Print Features: Learning Objectives | Practical Exercises | Key Terms
๐Ÿ›ก๏ธ Ancillaries: Test Bank* | Solutions Manual*
๐Ÿ“š Chapter concepts and theories introduced in Essentials of Political Analysis, 7th Edition
* = for instructors, available via Sage
2. Descriptive Statistics
This chapter teaches students how to summarize data with key statistics such as means, medians, and standard deviations. Using Excel functions, students will calculate and interpret these statistics to describe political variables clearly and accurately.
๐Ÿ“ Print Features: Learning Objectives | Practical Exercises | Key Terms
๐Ÿ›ก๏ธ Ancillaries: Test Bank* | Solutions Manual*
๐Ÿ“š Chapter concepts and theories introduced in Essentials of Political Analysis, 7th Edition
* = for instructors, available via Sage
3. Creating and Transforming Variables
Students will learn to derive new variables from existing data by using Excel formulas and logical functions. The chapter emphasizes common data transformations in political science research, including recoding, indexing, and calculating proportions.
๐Ÿ“ Print Features: Learning Objectives | Practical Exercises | Key Terms
๐Ÿ›ก๏ธ Ancillaries: Test Bank* | Solutions Manual*
๐Ÿ“š Chapter concepts and theories introduced in Essentials of Political Analysis, 7th Edition
* = for instructors, available via Sage
4. Making Comparisons
This chapter focuses on comparing groups within datasets, such as political parties or demographic categories. Students will use Excel tools like pivot tables and conditional functions to examine differences in variables across categories.
๐Ÿ“ Print Features: Learning Objectives | Practical Exercises | Key Terms
๐Ÿ›ก๏ธ Ancillaries: Test Bank* | Solutions Manual*
๐Ÿ“š Chapter concepts and theories introduced in Essentials of Political Analysis, 7th Edition
* = for instructors, available via Sage
5. Graphing Relationships and Describing Patterns
Students will create visual representations of data using Excel charts and graphs. This chapter teaches how to construct bar charts, scatterplots, and trendlines to reveal patterns and relationships among political variables.
๐Ÿ“ Print Features: Learning Objectives | Practical Exercises | Key Terms
๐Ÿ›ก๏ธ Ancillaries: Test Bank* | Solutions Manual*
๐Ÿ“š Chapter concepts and theories introduced in Essentials of Political Analysis, 7th Edition
* = for instructors, available via Sage
6. Random Assignment and Sampling
This chapter introduces students to basic principles of experimental design and probability sampling. Using Excelโ€™s random number and sampling functions, students will simulate random assignment and generate representative samples for political analysis.
๐Ÿ“ Print Features: Learning Objectives | Practical Exercises | Key Terms
๐Ÿ›ก๏ธ Ancillaries: Test Bank* | Solutions Manual*
๐Ÿ“š Chapter concepts and theories introduced in Essentials of Political Analysis, 7th Edition
* = for instructors, available via Sage
7. Making Controlled Comparisons
Students will learn to control for confounding variables when comparing groups, enabling more valid conclusions about causal relationships. Excel functions will be used to sort and group data to facilitate controlled comparisons.
๐Ÿ“ Print Features: Learning Objectives | Practical Exercises | Key Terms
๐Ÿ›ก๏ธ Ancillaries: Test Bank* | Solutions Manual*
๐Ÿ“š Chapter concepts and theories introduced in Essentials of Political Analysis, 7th Edition
* = for instructors, available via Sage
8. Foundations of Statistical Inference
Building on earlier chapters, this section introduces concepts such as the sampling distribution and confidence intervals. Students will use Excel to simulate sampling variability and calculate margins of error for political estimates.
๐Ÿ“ Print Features: Learning Objectives | Practical Exercises | Key Terms
๐Ÿ›ก๏ธ Ancillaries: Test Bank* | Solutions Manual*
๐Ÿ“š Chapter concepts and theories introduced in Essentials of Political Analysis, 7th Edition
* = for instructors, available via Sage
9. Hypothesis Tests with One or Two Samples
This chapter teaches students to conduct hypothesis tests using Excel for means and proportions from one or two samples. The focus is on testing for significant differences and interpreting p-values in the context of political data.
๐Ÿ“ Print Features: Learning Objectives | Practical Exercises | Key Terms
๐Ÿ›ก๏ธ Ancillaries: Test Bank* | Solutions Manual*
๐Ÿ“š Chapter concepts and theories introduced in Essentials of Political Analysis, 7th Edition
* = for instructors, available via Sage
10. Chi-Square Test and Analysis of Variance
Students will analyze categorical data with chi-square tests and explore differences in means across multiple groups using ANOVA. Excel tools are used to assess whether observed patterns are statistically significant.
๐Ÿ“ Print Features: Learning Objectives | Practical Exercises | Key Terms
๐Ÿ›ก๏ธ Ancillaries: Test Bank* | Solutions Manual*
๐Ÿ“š Chapter concepts and theories introduced in Essentials of Political Analysis, 7th Edition
* = for instructors, available via Sage
11. Correlation and Bivariate Regression
This chapter introduces students to correlation coefficients and simple linear regression. Using Excelโ€™s regression functions, students will model and interpret relationships between two political variables.
๐Ÿ“ Print Features: Learning Objectives | Practical Exercises | Key Terms
๐Ÿ›ก๏ธ Ancillaries: Test Bank* | Solutions Manual*
๐Ÿ“š Chapter concepts and theories introduced in Essentials of Political Analysis, 7th Edition
* = for instructors, available via Sage
12. Multiple Regression Analysis
Expanding on bivariate regression, students will conduct multiple regression analyses to account for the influence of several independent variables. Excel's regression output is used to interpret coefficients, significance levels, and model fit.
๐Ÿ“ Print Features: Learning Objectives | Practical Exercises | Key Terms
๐Ÿ›ก๏ธ Ancillaries: Test Bank* | Solutions Manual*
๐Ÿ“š Chapter concepts and theories introduced in Essentials of Political Analysis, 7th Edition
* = for instructors, available via Sage
13. Analyzing Regression Residuals
Students learn how to evaluate the quality of regression models by examining residuals. Excel tools are used to detect patterns, identify outliers, and assess violations of regression assumptions.
๐Ÿ“ Print Features: Learning Objectives | Practical Exercises | Key Terms
๐Ÿ›ก๏ธ Ancillaries: Test Bank* | Solutions Manual*
๐Ÿ“š Chapter concepts and theories introduced in Essentials of Political Analysis, 7th Edition
* = for instructors, available via Sage
14. Logistic Regression
This chapter introduces logistic regression for binary outcomes, such as voting behavior. Students will use Excel-based techniques to estimate logistic models and interpret odds ratios in a political context.
๐Ÿ“ Print Features: Learning Objectives | Practical Exercises | Key Terms
๐Ÿ›ก๏ธ Ancillaries: Test Bank* | Solutions Manual*
๐Ÿ“š Chapter concepts and theories introduced in Essentials of Political Analysis, 7th Edition
* = for instructors, available via Sage
15. Doing Your Own Political Analysis
The final chapter guides students through planning and conducting an original data analysis project. Emphasis is placed on framing research questions, analyzing data with Excel, and presenting findings effectively.
๐Ÿ“ Print Features: Learning Objectives | Practical Exercises | Key Terms
๐Ÿ›ก๏ธ Ancillaries: Test Bank* | Solutions Manual*
๐Ÿ“š Chapter concepts and theories introduced in Essentials of Political Analysis, 7th Edition
* = for instructors, available via Sage
Appendix: Description of Variables in Workbooks
This reference section provides detailed information on the datasets used throughout the companion, including definitions, coding schemes, and sources for all variables featured in the Excel workbooks.
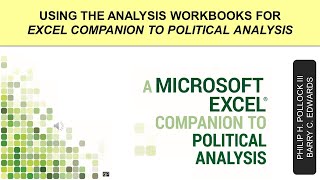
๐Ÿ“ Print Features: Learning Objectives | Practical Exercises | Key Terms
๐Ÿ›ก๏ธ Ancillaries: Test Bank* | Solutions Manual*
๐Ÿ“š Chapter concepts and theories introduced in Essentials of Political Analysis, 7th Edition
* = for instructors, available via Sage
Request Free Instructor Copy from Sage Publishing

Watch & Learn
thumbnail preview
โ–บ
i
Barry Edwards discusses the Significance Testing and Probability Distributions Workbooks featured in Excel Companion to Political Analysis..
 Using the Analysis Workbooks for Excel Companion to Political Analysis
Ancillary Resources