
|
|
|


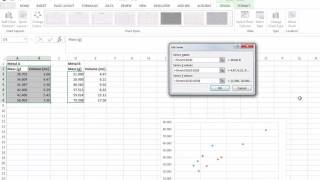 | ||
| Graphing Two Data Series on the Same Scatterplot | ||
Plot two data sets on the same scatterplot for visual comparison (6:07). |
| See All Political Science Journals |
| Robust Regression with R Tutorial | ||
| Alastair Sanderson shows useful methods used to handle data with outliers. |
| CRAN Task View: Econometrics | ||
| Describes many R packages and resources for econometric analysis, including regression, instrumental variables, panel data, times series, and more. |
| R Functions and Packages for Political Science Analysis | ||
| Great tutorials on useful functions and packages. |
| Zelig | ||
| Easy-to-use, free, open source, general purpose statistics program for estimating, interpreting, and presenting results from any statistical method. |
| Quick-R: Graphs | ||
| Useful reference on several common types of R graphs. |
| R Graph Gallery | ||
| Hundreds of distinctive graphics made with the R programming language, always with the reproducible code snippet available. |
| R Package Documentation | ||
| A comprehensive index of R packages and documentation, tools to run code online and embed samples. |

| See All Authors with Datasets |